About 50 min one-to-one, or 60 min with a small group
1. Warm up (5 to 10 min): Ask the quick questions with notes closed.
2. Teach: Work through the lesson slides in order.
3. Coach practice: Use the student examples and try-it tasks.
4. Check: Finish with the outcome prompts below.
Warm-up questions
On a position-time graph, what does a flat line tell tutors?Listen for: The object is standing still. Listen for whether they read slope or height.
A car speeds up from a stop sign. What would its velocity-time graph look like?Listen for: A line rising from zero. This checks whether they picture acceleration on a graph.
What does the area under a velocity-time graph represent?Listen for: The displacement. Any guess is fine; this previews the lesson.
What to check they understood
20-A1.3k
Ask them to find the acceleration of a cart whose velocity rises from 2.0 m/s to 8.0 m/s in 3.0 seconds, and sketch the graph.
A strong answer subtracts to get a change of 6.0 m/s, divides by 3.0 s to get 2.0 m/s², and draws a straight rising line on a velocity-time graph.
20-A1.2s
Ask them to read the displacement from a velocity-time graph of a car moving at 10 m/s for 5.0 seconds.
A strong answer finds the area of the rectangle, 10 m/s times 5.0 s, to get 50 m, and states the direction.
Likely gaps from earlier grades
Students read the height of a position-time graph as speed. Speed is the slope, how steep the line is.
Class slides
Work through the class slides
1 / 7
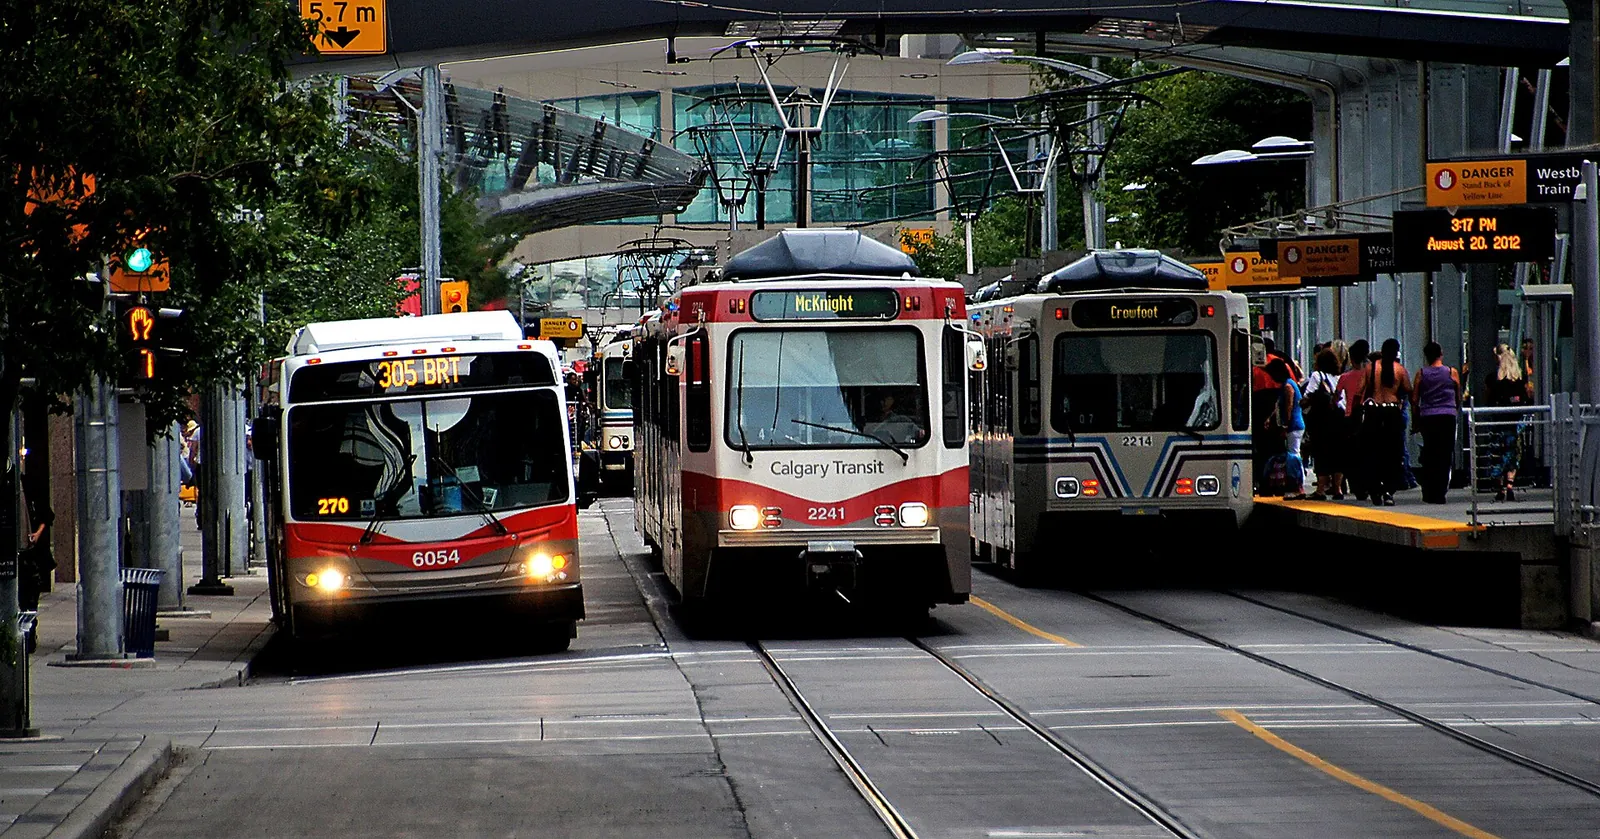
An LRT departure
A Calgary CTrain on the Red Line leaves Somerset-Bridlewood from rest and reaches 18.0 m/s north in 9.00 s.
Average velocity uses displacement over elapsed time, and acceleration uses the velocity change over elapsed time.
A Calgary CTrain. Leaving a station, a train speeds up at a fairly steady rate for several seconds. That steady speed up is constant acceleration, so its velocity time graph is a straight line sloping upward.